# Libraries
library(sf)
library(dplyr)
library(osmdata)
library(osrm)
library(ggplot2)
library(showtext)
library(sysfonts)
library(ggtext)
library(patchwork)
library(ggbranding)
library(scales)

# Fonts
showtext_auto()
showtext_opts(dpi = 600)
font_add_google("Oswald", "oswald")

# Define Bain des Pâquis location (approximate coordinates)
bain_paquis <- data.frame(
  name = "Bain des Pâquis",
  lon = 6.1512,
  lat = 46.2107
) |>
  st_as_sf(coords = c("lon", "lat"), crs = 4326)

# Define Geneva bounding box
geneva_bb <- c(6.04, 46.15, 6.25, 46.27)

# Get streets for context
streets <- geneva_bb |>
  opq() |>
  add_osm_feature(
    key = "highway",
    value = c("motorway", "primary", "secondary", "tertiary")
  ) |>
  osmdata_sf()
streets <- streets$osm_lines

# Get smaller streets
streets_small <- geneva_bb |>
  opq() |>
  add_osm_feature(
    key = "highway",
    value = c("residential", "service", "unclassified")
  ) |>
  osmdata_sf()
streets_small <- streets_small$osm_lines

# Get water features
water <- geneva_bb |>
  opq() |>
  add_osm_feature("water", c("river", "lake")) |>
  osmdata_sf()
water_multipoly <- water$osm_multipolygons |>
  st_make_valid()

# Calculate isochrones from Bain des Pâquis
# Using bike profile with breaks at 6, 11, 16, 21, 31 minutes
isochrones <- osrmIsochrone(
  loc = bain_paquis,
  breaks = c(6, 11, 16, 21, 31),
  osrm.profile = "bike"
)

# Remove water areas from isochrones
sf_use_s2(FALSE)
water_union <- st_union(water_multipoly) |> st_make_valid()
isochrones <- st_difference(isochrones, water_union)
sf_use_s2(TRUE)Day 07 - Isochrones
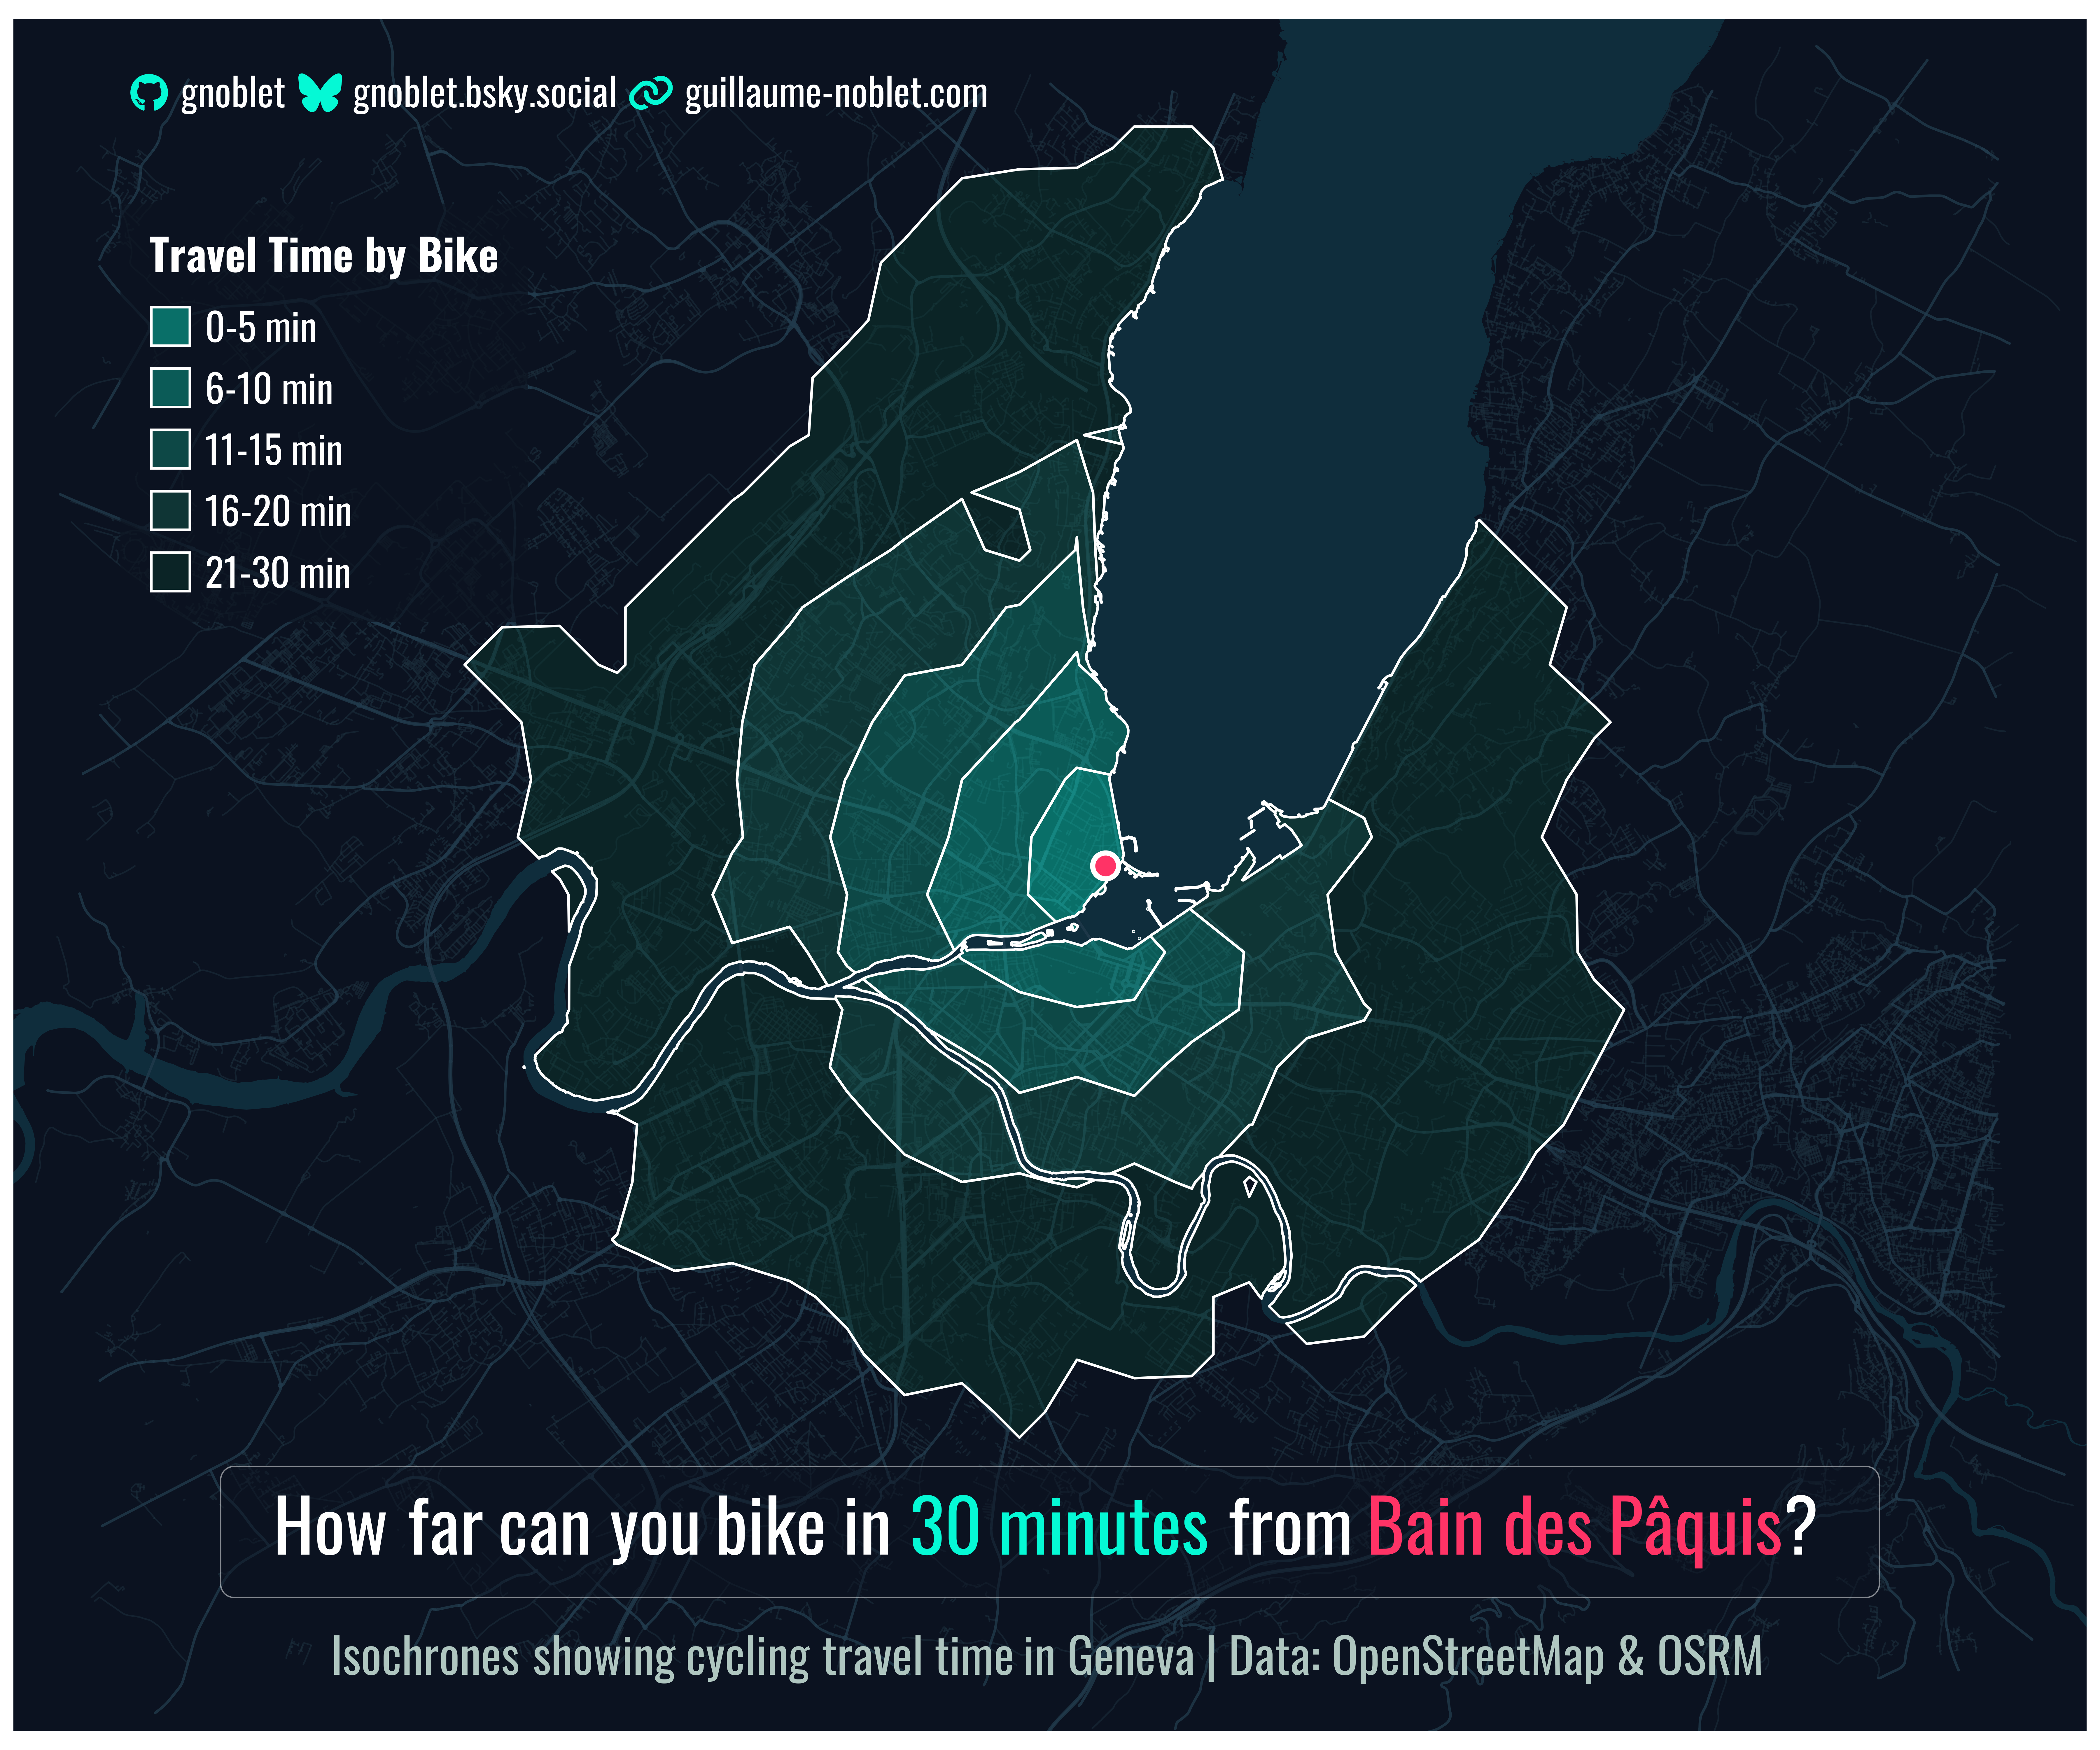
Isochrones: Travel Time by Bike to Geneva’s Jet d’Eau
Let’s create isochrones showing travel time by bike to Geneva’s iconic Jet d’Eau using the osrm package for routing and sf for spatial operations.
# Colors
bg_fill <- "#0b1220"
major_road <- "#21394bff"
minor_road <- "#1a2d3aff"
water_fill <- "#123f4f"
iso_colors <- c("#05f9d5ff", "#0ac9aaff", "#0f9980ff", "#146955ff", "#0b3f30ff")

# Main Plot
p <- ggplot() +
  # Water
  geom_sf(
    data = water_multipoly,
    fill = water_fill,
    color = NA,
    alpha = 0.6
  ) +
  # Smaller streets
  geom_sf(
    data = streets_small,
    color = minor_road,
    linewidth = 0.3,
    alpha = 0.6,
    lineend = "round"
  ) +
  # Major streets
  geom_sf(
    data = streets,
    color = major_road,
    linewidth = 0.5,
    alpha = 0.8,
    lineend = "round"
  ) +
  # Isochrones
  geom_sf(
    data = isochrones,
    aes(fill = factor(isomax)),
    color = "#ffffff",
    linewidth = 0.5,
    alpha = 0.4
  ) +
  # Bain des Pâquis location
  geom_sf(
    data = bain_paquis,
    color = "#ffffff",
    fill = "#ff3366",
    shape = 21,
    size = 4,
    stroke = 1.5
  ) +
  # Color scale
  scale_fill_manual(
    values = setNames(iso_colors, c("6", "11", "16", "21", "31")),
    labels = c("0-5 min", "6-10 min", "11-15 min", "16-20 min", "21-30 min"),
    name = "Travel Time by Bike"
  ) +
  # Coordinates
  coord_sf(
    xlim = c(geneva_bb[1], geneva_bb[3]),
    ylim = c(geneva_bb[2], geneva_bb[4]),
  ) +
  # Theme
  theme_void() +
  theme(
    plot.background = element_rect(fill = bg_fill, color = NA),
    panel.background = element_rect(fill = bg_fill, color = NA),
    legend.position = c(0.15, 0.77),
    legend.title = element_text(
      family = "oswald",
      color = "#ffffff",
      size = 18,
      face = "bold",
      margin = margin(b = 12)
    ),
    legend.text = element_text(
      family = "oswald",
      color = "#ffffff",
      size = 16
    ),
    legend.background = element_rect(
      fill = alpha(bg_fill, 0.7),
      color = NA,
      linewidth = 0.5
    ),
    legend.key = element_rect(color = NA),
    legend.key.spacing.y = unit(8, "pt"),
    legend.margin = margin(12, 12, 12, 12)
  )

# Title
title <- paste0(
  "<span style='font-size:30pt; line-height:0.8; color:#ffffff; font-weight:700'>",
  "How far can you bike in ",
  "<span style='color:#05f9d5ff'>30 minutes</span>",
  " from ",
  "<span style='color:#ff3366'>Bain des Pâquis</span>?",
  "</span>"
)

# Subtitle
subtitle <- paste0(
  "<span style='font-size:20pt; color:#afc6c0ff'>",
  "Isochrones showing cycling travel time in Geneva | Data: OpenStreetMap & OSRM",
  "</span>"
)

# Branding
branding <- branding(
  github = "gnoblet",
  bluesky = "gnoblet.bsky.social",
  website = "guillaume-noblet.com",
  text_family = "oswald",
  text_color = "white",
  icon_color = "#05f9d5ff",
  text_size = "16pt",
  icon_size = "16pt"
)

# Add title and branding as insets
p <- p +
  inset_element(
    ggplot() +
      # Title
      geom_textbox(
        aes(label = title),
        family = "oswald",
        x = 0.5,
        y = 0.12,
        hjust = 0.5,
        valign = 0.5,
        halign = 0.5,
        vjust = 1,
        fill = bg_fill,
        alpha = 0.5,
        box.color = "#ffffff",
        box.padding = unit(c(12, 12, 12, 12), "pt"),
        width = unit(0.8, "npc")
      ) +
      # Subtitle
      geom_textbox(
        aes(label = subtitle),
        family = "oswald",
        x = 0.5,
        y = 0.02,
        hjust = 0.5,
        halign = 0.5,
        vjust = 1,
        fill = NA,
        box.color = NA,
        width = unit(0.8, "npc")
      ) +
      # Branding
      geom_textbox(
        aes(label = branding),
        x = 0.5,
        y = 0.98,
        family = "oswald",
        fill = NA,
        box.color = NA,
        hjust = 0.5,
        vjust = 0,
        width = unit(0.9, "npc")
      ) +
      theme_void(),
    left = 0,
    right = 1,
    bottom = 0,
    top = 1,
    align_to = 'full'
  )

# Save plot
ggsave("day_07.png", plot = p, width = 12, height = 10, dpi = 600)