# Colors
bg_fill <- "#0b1220"
major_road <- "#21394bff"
minor_road <- "#21394bff"
water_fill <- "#123f4f"
pt_with_bp <- "#05f9d5ff"
pt_without <- "#afc6c0ff"
# Fonts
showtext_auto()
showtext_opts(dpi = 600)
font_add_google("Oswald", "oswald")
# Main Plot
p <- ggplot() +
# Unnecessary since we clipped to Geneva bb
# coord_sf(
# xlim = st_bbox(geneva_bb)[c("xmin", "xmax")],
# ylim = st_bbox(geneva_bb)[c("ymin", "ymax")]
# ) +
# geom_sf(data = geneva_bb, fill = NA, color = NA) +
# Streets
geom_sf(
data = streets,
color = major_road,
linewidth = 0.45,
alpha = 0.8,
lineend = "round"
) +
# Smaller streets
geom_sf(
data = streets_small,
color = minor_road,
linewidth = 0.4,
alpha = 0.8,
lineend = "round"
) +
# Water
geom_sf(data = water_multipoly, fill = water_fill, color = NA, alpha = 0.6) +
# Accidents
geom_sf(
data = dat,
aes(
fill = factor(with_bike_pedestrian)
),
shape = 21,
size = 1.8,
stroke = 0,
alpha = 0.8
) +
# Color fill
scale_fill_manual(values = c("0" = pt_without, "1" = pt_with_bp)) +
# Remove legend
guides(fill = "none") +
# Theme
theme_void() +
theme(
plot.background = element_rect(fill = bg_fill, color = NA),
panel.background = element_rect(fill = bg_fill, color = NA)
)
# Title inset
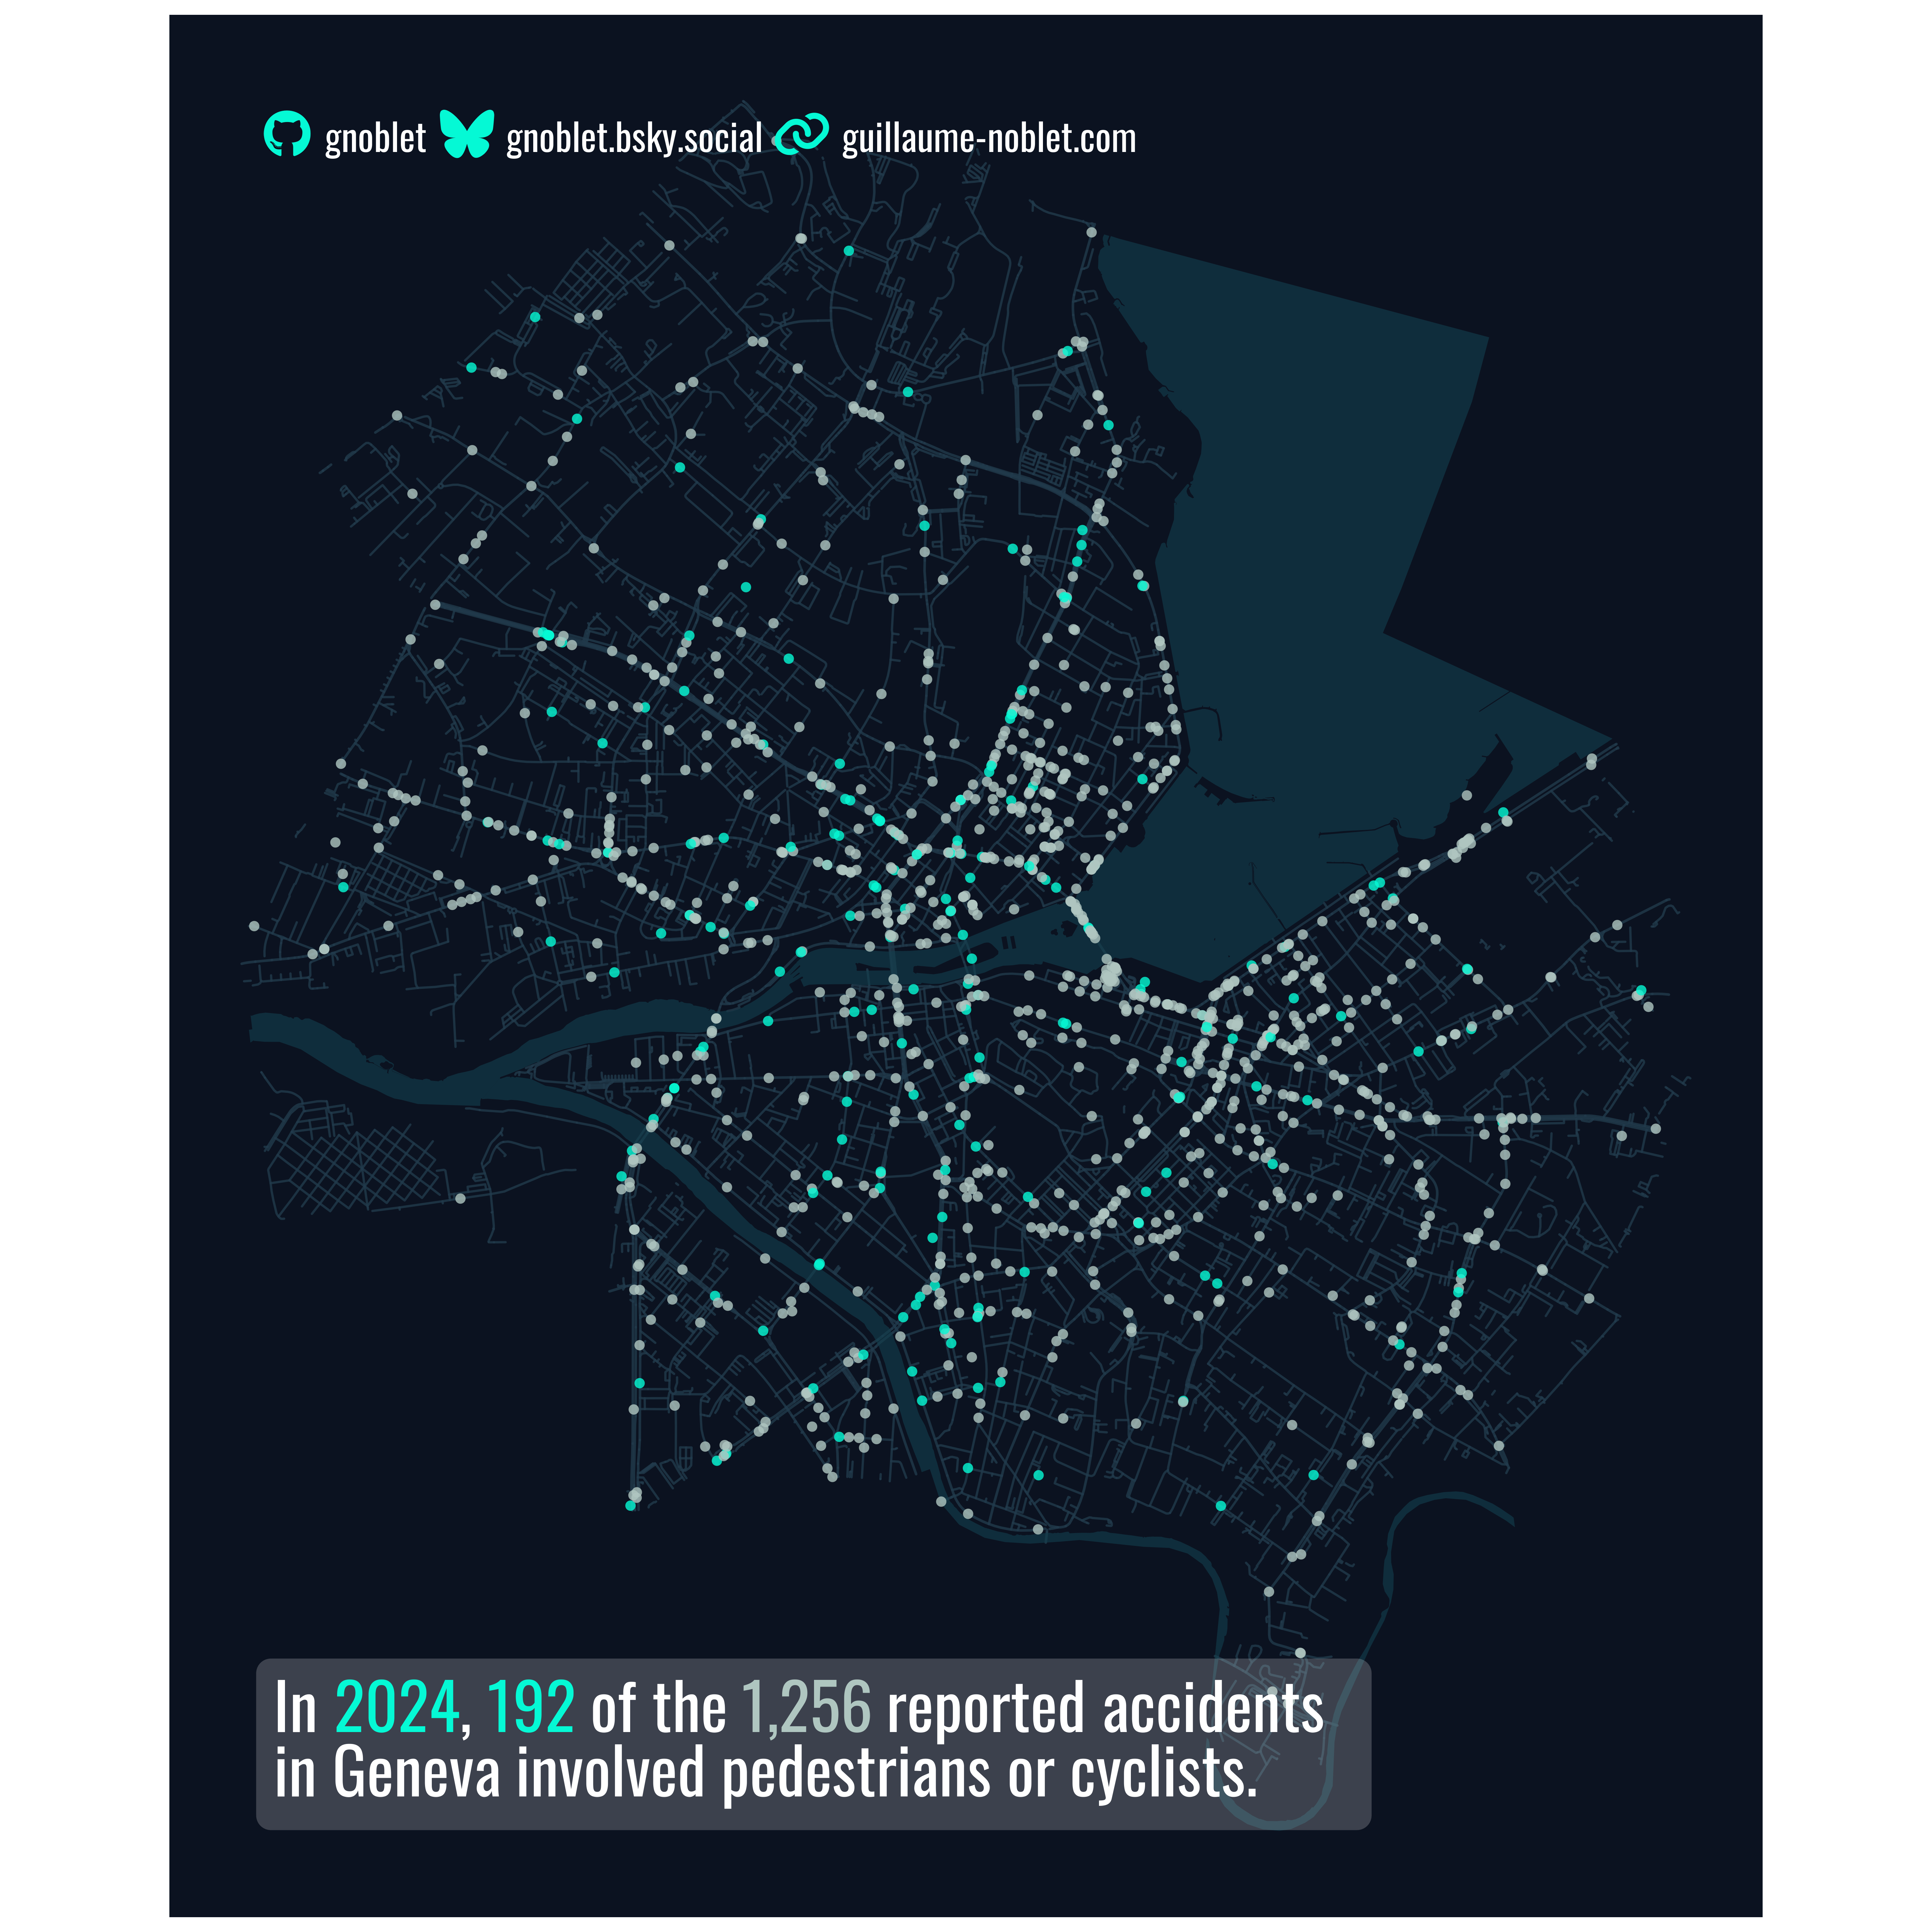
title <- paste0(
"<span style='font-size:24pt; line-height:0.7; color:#ffffff'>",
"In <span style='color:",
pt_with_bp,
"; font-weight:700'>2024</span>, ",
"<span style='color:",
pt_with_bp,
"; font-weight:700'>192</span> of the ",
"<span style='color:",
pt_without,
"; font-weight:700'>1,256</span> reported accidents in Geneva involved pedestrians or cyclists.",
"</span>"
)
# Branding inset
branding <- branding(
github = "gnoblet",
bluesky = "gnoblet.bsky.social",
website = "guillaume-noblet.com",
text_family = "oswald",
text_color = "white",
icon_color = pt_with_bp,
text_size = "14pt",
icon_size = "18pt"
)
# Add title and branding as insets
p <- p +
inset_element(
ggplot() +
# title
geom_textbox(
aes(
label = title
),
family = "oswald",
x = 0.01,
y = 0.05,
hjust = 0,
fill = "white",
alpha = 0.2,
box.color = NA,
box.padding = unit(c(8, 8, 8, 8), "pt"),
width = unit(0.7, "npc")
) +
# branding
geom_textbox(
aes(
label = branding
),
x = 0.5,
y = 0.98,
family = "oswald",
fill = NA,
box.color = NA,
hjust = 0.5,
width = unit(0.9, "npc")
) +
theme_void(),
left = 0,
right = 1,
bottom = 0,
top = 1,
align_to = 'full'
)
# Save plot
ggsave("day_01.png", plot = p, width = 10, height = 10, dpi = 600)